Introduction
Single-cell foundation models like Tahoe-x1[1] have demonstrated remarkable capabilities in understanding cellular biology, but their internal mechanisms remain largely opaque. These models learn rich representations by training on millions of cells, yet we don't fully understand what biological concepts they encode or how they make predictions.
At Lucent Cell, we applied sparse autoencoders (SAEs) to decompose the Tahoe-x1 model's learned representations into interpretable features. By training SAEs on intermediate layer activations, we can identify distinct features that each correspond to specific biological concepts, such as individual cell types, pathways, or disease states. This approach allows us to peer inside the "black box" and understand the biological knowledge encoded within foundation models.
Tahoe-x1 Model Architecture
Tahoe-x1[1] is a transformer-based foundation model trained on 266 million single-cell RNA-seq profiles, including 100 million perturbed cells exposed to various drug treatments across thousands of experimental conditions. The model's architecture is designed to learn from the complex patterns of gene expression that define cellular identity and state.
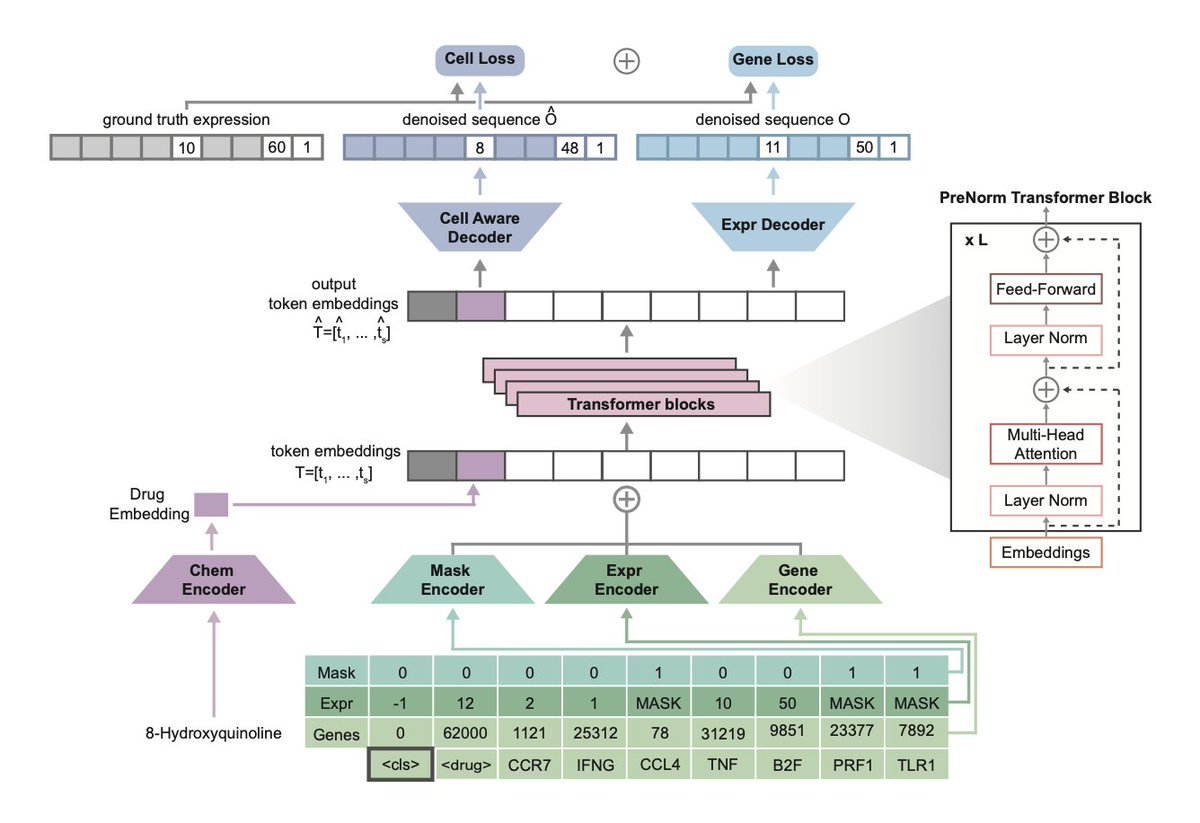
Figure 1: Tahoe-x1 Architecture (adapted from Figure 1 in Gandhi et al.[1]). Gene tokens are created by combining gene identity, expression level, and mask embeddings. The dual decoder architecture predicts masked gene expression using both token-level representations (gene-aware) and global cell context (cell-aware), enabling the model to learn both local gene-gene relationships and broader cellular programs.
The model represents each cell as a sequence of gene tokens. For each gene, three components are combined: a gene identity embedding (which specific gene it is), an expression level embedding (the gene's activity discretized into bins), and a mask embedding (indicating whether this gene is masked during training). When drug perturbation data is available, an additional chemical encoder initialized with Morgan fingerprints provides molecular context.
Tahoe-x1 is trained using a masked language modeling objective: random genes in each cell's sequence are masked, and the model must predict their expression values based on the context provided by other genes. This is accomplished through a dual decoder architecture, one decoder makes predictions using individual token representations (gene-aware), while another conditions its predictions on the global cell embedding from a special <cls> token (cell-aware). This design allows the model to capture both fine-grained gene-gene interactions and broader cellular context.
Through this training process across hundreds of millions of cells, Tahoe-x1 learns to encode gene co-expression patterns, biological pathway activations, cell type identities, and drug-gene interactions in its hidden layers. However, these representations are complex and entangled, making it difficult to understand what specific biological concepts the model has learned.
Methodology
To interpret Tahoe-x1's learned representations, we trained sparse autoencoders (SAEs) on its intermediate layer activations. SAEs decompose dense activation vectors into sparse linear combinations of learned features, where each feature ideally captures one independent biological concept. This allows us to identify what specific patterns, such as T cell identity, interferon response, or inflammatory signaling, are encoded in the model's hidden layers.
We used TopK sparse autoencoders[3], which enforce sparsity by allowing only the top k features to activate for any given cell, trained on activations from the Tahoe-x1 model[1] using the SAELens framework[2]. For each learned feature, we compute gene associations, cell type enrichments, and biological pathway correlations to determine what the feature represents.
Model Setup
- Foundation Model: Tahoe-x1 70M parameter model from HuggingFace
- Hook Points: Extracted activations from MLP outputs at layers 0, 3, 6, 9, and 11
- SAE Architecture: TopK SAE with k=64 active features and d_sae=16,384 total features
- Training Data: PBMC 3k dataset[4] with 2,700 cells and 32,738 genes
Training Process
# SAE Training Configuration
config = TopKTrainingSAEConfig(
    d_in=512,           # Tahoe hidden dimension
    d_sae=16384,        # SAE feature dimension
    k=64,               # Top-k sparsity
    learning_rate=3e-4,
    batch_size=4096
)

# Extract activations and train SAE
activations = extract_tahoe_activations(model, dataloader, layer=6)
sae = train_sparse_autoencoder(activations, config, steps=10000)
Technical Implementation
Our complete pipeline is available as an open-source Python package that integrates with the Tahoe ecosystem. Key components include:
- TahoeAdapter: Extracts activations from any Tahoe model layer
- SAETrainer: Configurable sparse autoencoder training with SAELens v6[2]
- FeatureAnalyzer: Computes gene and cell-type associations
- ValidationPipeline: Automated biological database validation
- DashboardGenerator: Creates interactive HTML visualizations
Feature Analysis and Outputs
For each of the 16,384 learned SAE features, our pipeline computes comprehensive biological associations to determine what each feature represents. This analysis produces several key outputs that make the features interpretable:
- Gene Rankings: For each feature, we identify the genes whose expression most strongly correlates with feature activation, ranked by both activation strength and frequency across cells
- Cell Type Enrichments: We compute which cell types preferentially activate each feature, revealing features that are specific to T cells, monocytes, or other cell populations
- Pathway Associations: Features are validated against biological pathway databases (Gene Ontology[5], KEGG[6]) to identify which biological processes they capture
- Disease/Phenotype Enrichments: We test for enrichment in disease-associated gene sets from HPO[7], GWAS Catalog[8], and Open Targets[9]
- Activation Patterns: We track which cells activate each feature and at what intensity, providing activation percentiles and frequency statistics
To facilitate exploration of these outputs, we created an interactive dashboard that provides feature-by-feature analysis with searchable, sortable gene lists, color-coded pathway associations, and expandable disease enrichment panels. The dashboard serves as a window into the 100 most interpretable features extracted from Tahoe-x1's layer 6 representations.
Explore 100 SAE Features
Interactive visualization of sparse autoencoder features trained on 100K cells from the Tahoe-x1 model[1], with biological validation against 8 major databases including HPO[7], GWAS Catalog[8], and Open Targets[9].
Launch Interactive Dashboard →Validation Results
To systematically evaluate whether the SAE features correspond to biologically meaningful concepts, we performed enrichment analysis against multiple curated databases. Enrichment analysis tests whether the genes associated with each feature are statistically overrepresented in known biological pathways, molecular functions, or disease gene sets. For each of the 100 analyzed features, we computed gene associations and tested for significant enrichment (p < 0.001, Fisher's exact test with Benjamini-Hochberg correction) across eight major biological databases.
This validation strategy allows us to determine whether the model has learned interpretable biological modules rather than arbitrary gene combinations. Features that show significant enrichment for well-characterized biological processes provide evidence that Tahoe-x1's internal representations align with established biological knowledge, despite receiving no explicit pathway annotations during training.
| Database | Description | P-value Threshold | Example Enrichments |
|---|---|---|---|
| Gene Ontology[5] | Molecular functions, biological processes, and cellular components | < 0.001 | Immune system process, interferon response, cytokine production |
| KEGG Pathways[6] | Metabolic and signaling pathway maps | < 0.001 | Cytokine-cytokine receptor interaction, JAK-STAT signaling |
| Human Phenotype Ontology[7] | Disease phenotypes and clinical abnormalities | < 0.001 | Abnormal inflammatory response, immunodeficiency, chronic infection |
| GWAS Catalog[8] | Genome-wide association study results | < 0.001 | Immune cell counts, inflammatory markers, autoimmune traits |
| Open Targets[9] | Disease-gene associations and drug targets | < 0.001 | Rheumatoid arthritis, inflammatory bowel disease, sepsis |
Across these databases, features consistently enriched for immune-related processes, which is expected given the PBMC dataset composition. Many features showed specific enrichments across multiple databases. For example, features enriched for T cell markers in Gene Ontology also showed enrichment for lymphocyte-related traits in GWAS Catalog, providing cross-database validation of biological interpretability.
Key Findings
1. T Cell Receptor Signaling Module
One feature captured a canonical T cell signature, with its top-activating gene being CD3E (max activation at 99th percentile, detected in 0.10% of cells), a core component of the T cell receptor (TCR)-CD3 complex essential for T cell activation[10]. The feature also strongly associated with ITK (IL2-inducible T cell kinase, 91st percentile), which plays a critical role in TCR signaling by phosphorylating PLCγ1 following TCR engagement, and RAC2 (93rd percentile), a Rho GTPase involved in T cell activation and migration.
The CD3 complex, comprising CD3ε, CD3γ, CD3δ, and CD3ζ chains, provides the primary signal for T cell activation through immunoreceptor tyrosine-based activation motifs (ITAMs) that undergo phosphorylation by Src kinase Lck[10]. The presence of CD3E alongside downstream signaling molecules like ITK suggests this feature captures not merely T cell identity, but the active T cell signaling state. This interpretation is supported by enrichment for lymphocyte-related traits in GWAS data (p < 0.001), including lymphocyte percentage of white cells and myeloid white cell counts.
2. Monocyte/Myeloid Activation and Innate Immunity
A second feature exhibited strong monocyte/myeloid specificity, with its two highest-activating genes being S100A8 (94.37 max activation, 99th percentile) and S100A9 (86.22 max activation, 98th percentile). These calcium-binding proteins form the heterodimeric complex calprotectin, which constitutes up to 40% of the cytosolic protein content in neutrophils and monocytes[11]. The feature also included LYZ (lysozyme, 48.98 activation, 94th percentile), a canonical monocyte/macrophage marker with antimicrobial function, and CST3 (cystatin C, 43.11 activation, 90th percentile), a cysteine protease inhibitor secreted by immune cells.
Calprotectin serves as a damage-associated molecular pattern (DAMP) in the extracellular space, functioning as an alarmin that stimulates neutrophil chemotaxis and cytokine release through TLR4 and RAGE receptor activation[11][12]. S100A8/A9 has been identified as an endogenous activator of TLR4, promoting MyD88-dependent and TRIF-dependent signaling pathways that result in NF-κB-mediated gene transcription[12]. Its presence in this feature, detected across 16.46% of cells for S100A8 and 18.72% for S100A9, reflects its role in the innate immune response. The feature showed significant enrichment for inflammatory disease phenotypes including familial cirrhosis (p = 1.23×10⁻⁵) and conditions associated with chronic inflammation, consistent with calprotectin's established role as a biomarker in rheumatoid arthritis and inflammatory bowel disease[11].
3. Pro-Inflammatory Cytokine and Chemokine Network
A third feature represented a coordinated inflammatory cytokine response, dominated by the CXC chemokine family. The top-activating genes were CXCL1 (90.82, 99th percentile), CXCL8/IL-8 (89.06, 98th percentile), CXCL2 (77.49, 97th percentile), and CXCL3 (71.28, 96th percentile), all potent neutrophil chemoattractants that signal through CXCR1 and CXCR2 receptors[13][14]. The feature also included the key pro-inflammatory cytokines IL1B (64.55, 94th percentile) and IL6 (67.06, 95th percentile), which are central mediators of the acute inflammatory response and inflammasome activation.
The CXC chemokines function hierarchically in neutrophil recruitment. CXCL1 mediates neutrophil adhesion and intraluminal crawling on inflamed endothelium, while CXCL2, presented by the atypical receptor ACKR1 on endothelial cell junctions, guides neutrophils to extravasation sites[14]. CXCL8 stands out as the most potent monomeric CXCR1 agonist[13]. The co-occurrence of these chemokines with IL1B and IL6 suggests this feature captures cells in an activated pro-inflammatory state, likely responding to bacterial infection or tissue damage. This interpretation is supported by enrichment analysis showing associations with thyroid dyshormonogenesis (p = 9.76×10⁻⁶) and abnormal circulating markers, reflecting the systemic nature of inflammatory responses.
Discussion and Future Directions
Our analysis reveals that Tahoe-x1 naturally organizes its representations around biologically meaningful concepts, cell types, pathways, and disease states, without explicit supervision. The interpretable features we extracted could guide drug target identification, particularly features that activate in disease-associated cellular states. Understanding which concepts the model captures (and which it misses) also provides insight for improving next-generation foundation models.
Future work includes feature steering to control model predictions, cross-model comparisons to understand shared versus model-specific representations, and clinical validation of feature-based insights in patient datasets.
Conclusion
By applying sparse autoencoders to Tahoe-x1, we demonstrated that single-cell foundation models learn interpretable biological representations that can be systematically decoded. This approach enables mechanistic understanding of what these models learn and how they make predictions, a crucial step toward building trustworthy AI systems for biology and therapeutic discovery.
References
- Gandhi, S., Javadi, F., Svensson, V., Khan, U., Jones, M.G., Yu, J., Merico, D., Goodarzi, H., & Alidoust, N. (2025). Tahoe-x1: Scaling Perturbation-Trained Single-Cell Foundation Models to 3 Billion Parameters. bioRxiv. https://api.semanticscholar.org/CorpusID:282385024
- Bloom, J., Tigges, C., Duong, A., & Chanin, D. (2024). SAELens. https://github.com/decoderesearch/SAELens
- Bussmann, B., Leask, P., & Nanda, N. (2024). BatchTopK Sparse Autoencoders. arXiv:2412.06410. https://arxiv.org/abs/2412.06410
- Duan, S. (2025). 3k PBMCs from a healthy donor. Figshare. DOI: 10.6084/m9.figshare.28414916.v1
- Ashburner, M., Ball, C.A., Blake, J.A., Botstein, D., Butler, H., Cherry, J.M., Davis, A.P., Dolinski, K., Dwight, S.S., Eppig, J.T., Harris, M.A., Hill, D.P., Issel-Tarver, L., Kasarskis, A., Lewis, S., Matese, J.C., Richardson, J.E., Ringwald, M., Rubin, G.M., & Sherlock, G. (2000). Gene Ontology: tool for the unification of biology. Nature Genetics, 25, 25-29. https://api.semanticscholar.org/CorpusID:10718909
- Kanehisa, M., Furumichi, M., Tanabe, M., Sato, Y., & Morishima, K. (2016). KEGG: new perspectives on genomes, pathways, diseases and drugs. Nucleic Acids Research, 45, D353-D361. https://api.semanticscholar.org/CorpusID:8537106
- Köhler, S., Gargano, M.A., Matentzoglu, N.A., Carmody, L., Lewis-Smith, D., Vasilevsky, N.A., Danis, D., Balagura, G., Baynam, G., Brower, A.M., et al. (2021). The Human Phenotype Ontology in 2021. Nucleic Acids Research, 49, D1207-D1217. https://api.semanticscholar.org/CorpusID:227259356
- Buniello, A., MacArthur, J.A.L., Cerezo, M., Harris, L.W., Hayhurst, J., Malangone, C., McMahon, A., Morales, J., Mountjoy, E., Sollis, E., et al. (2019). The NHGRI-EBI GWAS Catalog of published genome-wide association studies, targeted arrays and summary statistics 2019. Nucleic Acids Research, 47, D1005-D1012. https://api.semanticscholar.org/CorpusID:53568759
- Buniello, A., Suveges, D., Cruz-Castillo, C., Bernal Llinares, M., Cornu, H., Lopez, I., Tsukanov, K., Roldan-Romero, J.M., Mehta, C., Fumis, L., et al. (2024). Open Targets Platform: facilitating therapeutic hypotheses building in drug discovery. Nucleic Acids Research, 53, D1467-D1475. https://api.semanticscholar.org/CorpusID:274646035
- Mariuzza, R.A., Agnihotri, P., & Orban, J. (2019). The structural basis of T-cell receptor (TCR) activation: An enduring enigma. Journal of Biological Chemistry, 295, 914-925. https://pmc.ncbi.nlm.nih.gov/articles/PMC6983839/
- Inciarte-Mundo, J., Frade-Sosa, B., & Sanmartí, R. (2022). From bench to bedside: Calprotectin (S100A8/S100A9) as a biomarker in rheumatoid arthritis. Frontiers in Immunology, 13. https://www.frontiersin.org/journals/immunology/articles/10.3389/fimmu.2022.1001025/full
- Ehrchen, J.M., Sunderkötter, C., Foell, D., Vogl, T., & Roth, J. (2009). The endogenous Toll-like receptor 4 agonist S100A8/S100A9 (calprotectin) as innate amplifier of infection, autoimmunity, and cancer. Journal of Leukocyte Biology, 86, 557-566. https://pubmed.ncbi.nlm.nih.gov/19451397/
- Cambier, S., Gouwy, M., & Proost, P. (2023). The chemokines CXCL8 and CXCL12: molecular and functional properties, role in disease and efforts towards pharmacological intervention. Cellular and Molecular Immunology, 20, 217-251. https://www.nature.com/articles/s41423-023-00974-6
- Capucetti, A., Albano, F., & Bonecchi, R. (2020). Multiple Roles for Chemokines in Neutrophil Biology. Frontiers in Immunology, 11. https://www.frontiersin.org/journals/immunology/articles/10.3389/fimmu.2020.01259/full